XYZ data are point clouds representing measurements in arbitrary sets of points in the xy plane. In SPM context it is generally assumed the data define a function in the plane, i.e. one point in the xy plane correspond to one z value, at least conceptually. More general XYZ data can represent arbitrary three-dimensional shapes. However, this is unusual in SPM and Gwyddion currently assumes the data correspond to a single-valued surface.
One important consequence is that XYZ data sets that vary in z values but are defined on the same points in the xy plane are considered “compatible” in Gwyddion. Many operations can be performed more directly with compatible data, or only make sense with compatible data.
The XYZ data processing options, found in the menu, are at present limited. XYZ data windows, as shown in the following figure, provide the basic visualisation of XYZ data: a preview raster image. The preview image is calculated using a fast method that provides a result close to nearest neighbour interpolation of the XYZ data. Resizing the window only resizes the preview image. Use the button to recalculate the preview image for the current window size.
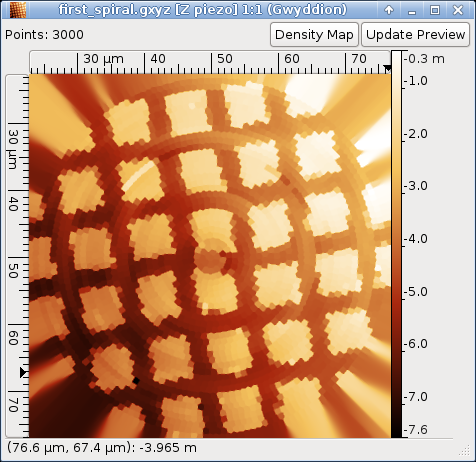
It is also possible to switch between preview of the data and display of the XYZ point density using the toggle button. The behaviour with respect to window resizing is the same as for the data.