Two-dimensional data are presented in so called data windows. It is the main widget used for working with Gwyddion. The data are presented as a field of false colours corresponding to heights. Colour axis that represents mapping of colours to real height values is on the right side of the data window.
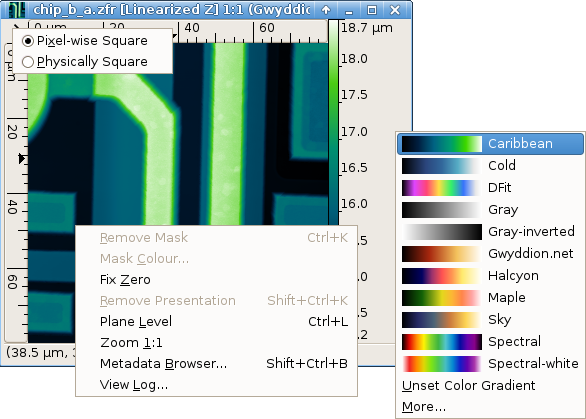
The False colour palette used to represent height data can be changed by clicking on the colour axis with right mouse button (i.e. invoking context menu) and selecting a palette from the list. Most frequently used palettes are available directly in the context menu; however you can reach much more of the possible palettes using the menu entry. Moreover, you can use the colour gradient editor to create your own palettes and select which palettes should be displayed in the short list.
There is a context menu available also for the data area. This menu consists of basic data and presentation operations. To reach all the possible operations use menu at the Gwyddion main window, or use some of the tools available at the Tools set of buttons at the Gwyddion main window.
The arrow in the upper left corner brings the aspect ratio switch menu. The data can be displayed either with pixels mapped with 1:1 aspect ratio to screen pixels (Pixelwise Square), or with physical dimensions mapped 1:1 onto the screen (Physically Square). For instance a sample of size 1×1 μm scanned with reduced slow axis resolution and having therefore 512×128 pixels, can be displayed either in 512×128 or 512×512 window.