Volume data are three-dimensional data representing, for instance, grid spectroscopy (spectra in each image point) or time evolution of the image. So, depending on the point of view, they can be imagined as either a stack of identically-sized images or as a set of curves forming a regular grid (image). This differentiates volume data from curve maps in which each curve is different they cannot be viewed as a stack of images.
Gwyddion currently offers some basic visualization and extraction tools in the menu. Volume data windows, as shown in the following figure, provide the most basic visualisation of volume data: an “preview” image, representing one plane of the volume data or other associated two-dimensional data. The x and y coordinates of the image correspond to the x and y coordinates of the volume data; the z coordinates can be imagined as orthogonal to the screen.
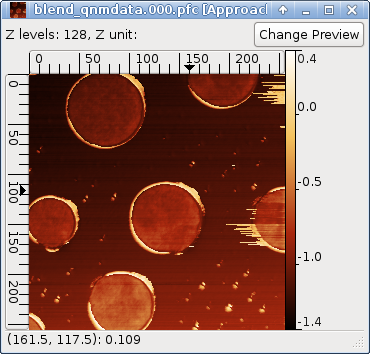
Button near the top of the window can be used to change the preview image. The preview can either be calculated as a summary quantity characterising data along the invisible z direction (minimum, maximum, mean, …), chosen as a section of the volume data, alternatively just any two-dimensional data of the same dimensions can be shown as the preview.