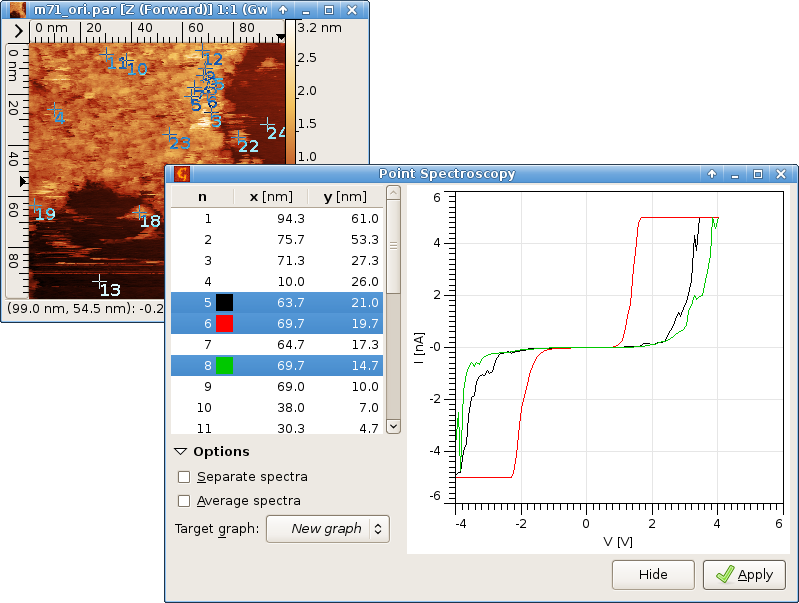
Gwyddion currently offers some basic visualization and extraction means for single point spectroscopy data (we will generally refer to any curves measured in or otherwise attached to individual points of the sample as to “spectra” here). If spectra import is supported for a file type, they will appear in the Spectra tab of the data browser. Standalone spectra files can be added to the two-dimensional data using file merging.

The primary spectra visualization and extraction tool is the Point Spectroscopy tool. It displays a list of measurement points and shows their positions on the data window. Individual curves can be selected either in the list or by selecting the corresponding crosses on the data window. If the file contains more than one spectrum set, one can choose among them by selecting the desired one in the Spectra tab list of the data browser.
The button then extracts the selected set of curves into a graph that can be further analysed by graph functions, such as force-distance curve fitting.