Data browser is a window that displays the structure of currently focused file. It shows the content as represented in Gwyddion which may differ somewhat from the organization in the original software.
Gwyddion supports an arbitrary number of two-dimensional data fields per file. Depending on the context, they are also often called images or height fields in this guide (individual images are also occasionally called channels although other, non-image data types consist of channels as well). The dimensions of images in one file may differ and also the physical dimensions and values can be arbitrary physical quantities.
In addition, one-dimensional data, represented as graphs, and single-point spectra can be present in the same file. The data browser is a tool for browsing and managing all the available data in the file.
Since the data browser always displays the structure of currently
focused file, its contents change as you switch between different
windows, possibly showing data from different files. There is no
difference between native Gwyddion files (.gwy)
and other files. Once a file is loaded its structure is shown as if it
was a Gwyddion file.
The data browser has several tabs, one for each type of data that can be present in the file:
- Images
- Graphs
- Spectra
- Volume
- XYZ
- Curve Maps
Each list shows names of the data objects and some additional properties that depend on the specific data type. The names can be edited after double-clicking on them.
Individual images, graphs, spectra, volume, XYZ or curve map data can be deleted, duplicated or extracted to new Gwyddion native file using the buttons at the bottom of the browser. It is also possible to copy them to another file by dragging a data browser row to any window belonging to the target file. To rename a data item, select it and press Enter or triple-click on it with the mouse.
The close button in the top right corner of the data browser closes the current file, discarding all unsaved changes. A file is also closed when all windows displaying data from this file are closed.
If the data browser is closed it can be recalled using the → command.
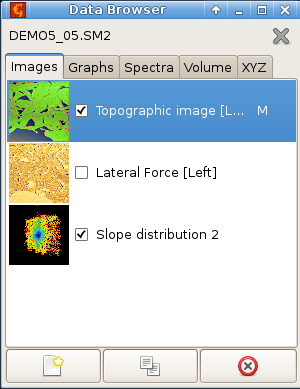
The image list shows thumbnails, check-boxes controlling whether the image is visible (i.e. displayed in a window) and image names. Right to the name the presence of presentation, mask or calibration is indicated by the following letters:
- M – mask
- P – presentation
- C – calibration
The graph list shows check-boxes controlling whether the graph is visible and graph names. Right to the name the number of curves in the graph is displayed.
The spectrum list shows the spectra name and the number of points in the set. Since single-point spectra are displayed and operated on only in connection with a two-dimensional data using the spectroscopy tool, there is no check-box controlling the visibility.
The volume data list shows the data name and the number of levels in the z direction, i.e. perpendicular to the section displayed in the window. A letter Z after the number of levels indicates the presence of a z-axis calibration.