Presentations and masks are secondary images with specific functions attached to the data. Presentation is a different image displayed over the actual data. Mask represents an irregular set of selected pixels. Their presence is indicated by the flags P (presentation) and M (mask) in the data browser.
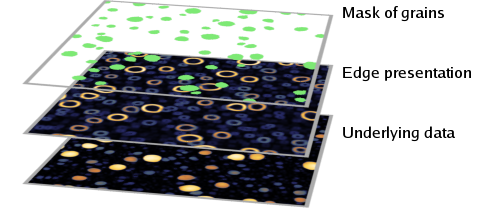
Visualization of masks and presentations. If you look from above they can be imagined to be stacked as in the picture.
Both masks and presentations can be removed from the data by functions in the right-click menu of the data window, or with keyboard shortcuts.
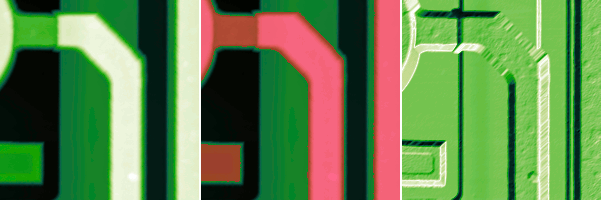
Data in default false colour representation (left), with superimposed mask visualized with a red colour (centre) and with shading presentation (right).
Presentations can be used to show the height field in another way than as a false colour map of the heights, for instance with shading or with highlighted edges. It is also possible to superimpose an arbitrary data field over another one as the presentation.
Note the superimposed presentation is really only a presentation, it is never used for calculations. In all data processing functions or tools the results are always computed from the original underlying data. Since presentations can be computationally intensive to calculate, they are not automatically updated when the underlying data change. The various presentations available are described in section Presentations.
Since the values of the presentation image have arbitrary absolute scale and may not even correspond to any meaningful physical quantity, the false colour map ruler on the right side of the data window does not display any ticks nor the minimum and maximum value when a presentation is shown.
Masks are used for special areal selections, e.g. grains, defects or facets with certain orientation. Masks can have any shape and within the data window and they are visualized by a colour overlaid over the data. The mask colour and opacity can be changed in the right-click context menu of the data window.
Many functions, especially statistical, levelling and row correction functions, can use masks to include or exclude areas from the calculation. This choice is presented as Masking Mode with the options to exclude the masked region, include only the masked region or ignore the mask and use the entire data. Note that this choice is usually displayed only if a mask is present.
Since grain marking is the most common use of masks, several functions that operate on marked areas are called “grain” functions, e.g. Grain Statistics. Also, a contiguous part of mask is sometimes called grain in this guide. However, since a mask does not bear any information how it was created all mask functions can be used with masks of any origin.