Exporting data to plain text file can be often useful for further processing in other software as text files are highly portable.
- Image data
Image data can be exported simply by invoking → and selecting file name extension
.txtor choosing ASCII data matrix (.txt) from the file save dialogue. This writes the current channel as a matrix of values, each line in the file corresponding to one image row. Optionally, the export of all channels can be concatenated and written to one file (separated by blank lines).Exactly the same method allows also exporting image data to simple three-column text files as XYZ data. Just select file name extension
.xyzor choose the XYZ text data (.xyz) format instead.- Graph curves
Graph curves are exported using from either the menu or graph right-click context menu.
- Volume data
A number of functions which calculate lists and sets of values offer their export as tabular data. The following figure shows an example from the Statistical quantities tool.
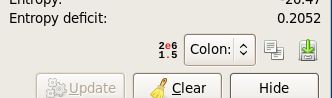
Controls for tabular data export, from left to right: scientific number format switch, data format selector, copy to clipboard and save to file buttons.
The scientific number format switch controls whether numbers are written
in the machine-readable scientific format, with decimal dot (regardless
of locale settings) and e for power of 10. When it is
switched on, the values are also written in base units – metres, as
opposed to micrometres or kilometres, for instance. This means output
like
Minimum: 3.32e-9 m
Maximum: 1.20e-9 m
With format intended to be human-readable (scientific format switched off) the same values could be formatted
Minimum: 3,32 nm
Maximum: 1,20 nm
if Gwyddion runs in an environment where comma is used as the decimal separator.
The overall format of tabular data is controlled by the data format selector with the following choices (not all may be present if they do not make sense in particular context):
- Colon:
Somewhat free format intended mainly to be human-readable. The label is separated by a colon and the value and unit are simply printed together and aligned:
Maximum peak height (Sp): 6.6754 nm
Maximum pit depth (Sp):   6.1039 nm
Maximum height (Sz):      12.7793 nm
- TAB
Fixed number of columns – typically name, value, error, unit – separated by the TAB character (ASCII 9). The previous example could be formatted:
Maximum peak height (Sp)↦6.6754↦↦nm
Maximum pit depth (Sp)↦6.1039↦↦nm
Maximum height (Sz)↦12.7793↦↦nm
where ↦ stands for the TAB character. Note the empty columns for value errors. If the table can contain errors under some circumstances, which is for statistical quantities the case when measurement uncertainties are present, the corresponding columns appears always, even if they are empty. This prevents format inconsistency with and without errors.
- CSV
Comma-separated values, a common (although not really standardised) format with a fixed number of columns separated by commas. Sometimes semicolons are also used despite the name, however, Gwyddion writes files with comma as the separator. The previous example could be formatted:
"Maximum peak height (Sp)","6.6754","","nm"
"Maximum pit depth (Sp)","6.1039","","nm"
"Maximum height (Sz)","12.7793","","nm"