grapherAD
grapherAD is a graphing monitor for a custom spectroscopic ellipsometry and spectrophotometry data fitting software used with the newAD optical data fitting software used at Masaryk University.
The data fitting runs on a heterogenous PVM-based computational cluster and the primary purpose of grapherAD is real-time graphical display of data obtained from PVM (fitting parameter control and evolution visualization is the task of in a separate program). However, it can also display local data files – although only in the format produced by the fitting software. A sample data file is included in the tarball, so you can try it if you wish.
As its name suggests, grapherAD uses mainly the graphing widgets of
Gwyddion plus a few other utility functions (for instance its view setup file
is a serialized GwyContainer with the format identical to
Gwyddion settings).
| Source code tarball (bzip2): | grapherAD.tar.bz2 | 2009-03-16 | 855 kB |
| Source code tarball (gzip): | grapherAD.tar.gz | 2009-03-16 | 1.37 MB |
See README in the tarballs for some usage notes. The code
in the tarballs here has the PVM communication parts disabled by default.
Therefore the compilation requirements are only:
- Linux/Unix system
- Gwyddion 2.7 or newer, including development files
Note there is no configure script in the tarball, just a
Makefile, because the program is used on a handful of computers
in a well-defined environment, therefore we do not need
configure and it seemed an overkill to create one just for this
publication. It should compile all right if you have the dependencies
installed though.


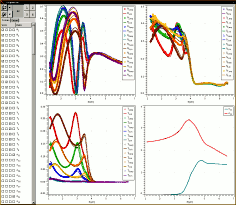
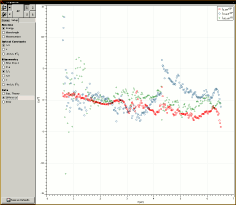
Two screenshots of grapherAD. The left shows a curve list and
a multi-graph view with reflectance and transmittance data under fitting and
and optical onstants. The right shows the setup pane and a single-graph view
showing the difference between fitted and experimental ellipsometry data.
