What is new in version 2.0
The following list gives an overview of major user-visible changes in version 2.0 compared to the previous stable version, which is 1.16. There were even more change under the hood, see version history for a more detailed list.
General

- Files can contain an arbitrary number of channels and graphs.
- Channels and graphs are controlled with a Data browser, they can be copied between files or extracted to new files.
- There were certain file format has changes. Old files are imported to Gwyddion 2.x smoothly. Gwyddion 1.7 and newer should be able to load the new files, however it will only display the first data channel and it will not be able to read selections, metadata or 3D view settings.
- Toolbox and other icons are larger, colorful and hopefully less ugly, seldom used functions in toolbox were replaced with more useful ones.
- Channel metadata are editable.
- Gtk+ 2.6 is required, 2.8 on MS Windows. GtkGLExt is only optional dependency now.
- FFTW library can be compiled in to speed up integral transforms and PSDF calculations.
Graphing

- Graphs are first class entities now.
- Curve data is accessible as a text table.
- Export to vector (PostScript) and bitmap (PNG) images, improved export to text.
- Logarithmic scales.
- Zoom and value reading was integrated to graph window.
- More graph, curve and axis properties can be adjusted.
- Curve leveling module was added.
- Look and formatting was improved.
- Ctrl-C copies graph image to clipboard.
Data windows

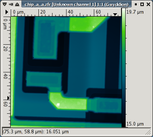
- Data with non-1:1 pixel aspect ratios can be displayed both with square pixels or identical pixel:real measures on both axes.
- Color axis can have ticks and better matches color range mapping mode.
- Color gradients are editable and a greater choice of them is distributed.
- Channel lateral coordinates origin can be offset from (0, 0).
- Ctrl-C copies false color data image to clipboard.
3D view

- GL materials are editable and a greater choice of them is distributed.
- Ctrl-C copies 3D view image to clipboard.
File loading and saving
- Import support was added for
- Nanoscope 3 and 4
- Pacific Nanotechnology PNI
- Nanonis SXM
- SEIKO XQD
- ECS
- an older Hitachi AFM format
-
Physical scales of data imported from Burleigh v2.1 were corrected.

- File type selection is integrated to file dialogs.
- File load and save problems problems are reported GUI-wise instead of console messages.
- Recent files menu items have file thumbnails.
- It is possible to switch off automatic attempts to import unknown files as raw data.
Tools
- Tool dialog state is more explicitly controlled by the user, Esc hides tool dialogs as well as clicking on their button again, tool dialogs can be visible when no data is loaded.
- Selection can be constrained by holding Shift:

- rectangles to squares
- ellipses to circles
- lines to multiples of 15 degrees
- It is possible to enter rectangular selection boundaries manually in tools.
- Adaptive mapping was added to Color range tool.
- Distance tool displays value difference and allows much more lines.
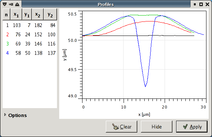
- Profile tool allows much more profiles.
- Value reading tool uses true circular neighbourhoods for averaging instead of squares.
- Three-point level tool can perform instant apply. It too uses true circular neighbourhoods for value averaging and it shows their size on the data.
- Crop tool can resize in place or create a new channel.
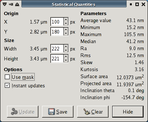
- Statistical quantities tool can save values to a file, it can use only the area under a mask.
- Spot removal tool chooses area of interest on the main window and the precise area to interpolate on the zoomed view.
- Mask editor tool was completely reworked, featuring elliptic selections, clearing, filling, inversion, growing and shrinking.
Data processing

- Scars module can remove negative and positive deffects at once.
- Grain distribtion module can calculate distributions of many new quantities: areas, surface areas, boundary lenghts, bounding sizes and corresponding angles, maxima, minima, means, medians. It can also write raw values for individual grains to a text file.
- Grain mark and remove by threshold can show instant preview.
- Level and Level rotate can exclude/use only data under a mask for leveling.
- Shade can mix original and shaded data.
- Hough lines and Harris corner methods were added to Edge module.
- Presentationops can create logarithmical scale presentation.
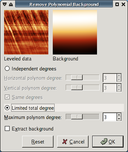
- The maximum polynomial degree in polynomial background removal was significantly increased and it is possible to subtract a polynom of limited total degree.
- Speed improvements in Correlation, Laplace, grain functions; common stats like data minima and maxima are cached.
- Mask grow and shrink modules were removed, superseded by Mask editor tool.
New data processing modules
- Match line correction: Levels rows without destroying features (experimental).
- Step line correction: Levels and interpolates bad row segments instead of complete rows.
- Immerse: Immerses a high-resolution detail to a larger image.
- Merge: Merges two images to one.
- Hough: Performs Hough transform.
Regressions
- Nanoindentation analysis module was removed due to excessive brokeness and the lack of maintainer.
- DWT denoise and Nanoindent adjust modules were not ported yet.
1.15 (yeti, 2014-06-08 11:10:03)
© David Nečas and Petr Klapetek
