Microscopy data often need to be rendered into image formats, usually for
presentation purposes, occasionally to open them in programs that do
not support any SPM data format. Both is achieved the same way in
Gwyddion: by selecting
→
and choosing a file name corresponding to an image format, e.g.
channel.png or channel.tiff.
The reference section High-Depth Image
Formats describes the export of data as high-depth greyscale images
that should be still usable as quantitative data. For supported formats
you can enable it using the Export as 16 bit
greyscale check-box at the top of the image export dialogue. The
rest of this section discusses the creation of nice images for publications
and presentations.
Gwyddion can render images into a number of formats, including for instance PNG, PDF, SVG, EPS, TIFF, WebP, BMP, PPM, TARGA and JPEG. Depending on the intent, some may be more suitable than others. Generally, the following choices can be recommended:
- PDF (Portable Document Format) for high-quality rendering suitable for printing, with all text and lines perfectly sharp and clean at any scale. Gwyddion also supports output to EPS (Encapsulated PostScript) for the same purpose, however, some features currently seem to work better in the PDF output.
- PNG (Portable Network Graphics) for web pages, low-resolution previews, thumbnails and icons, and also if you have to use a raster image format because it is the only option. PNG is a modern and widely supported raster image format with good loseless compression and a number of nifty features, including full transparency support.
- SVG (Scalable Vector Graphics) for subsequent editing and processing. SVG is a modern vector graphics format. You can open in a vector image editor such as Inkscape and modify it or combine with other images – keeping all text and lines perfectly sharp and clean.
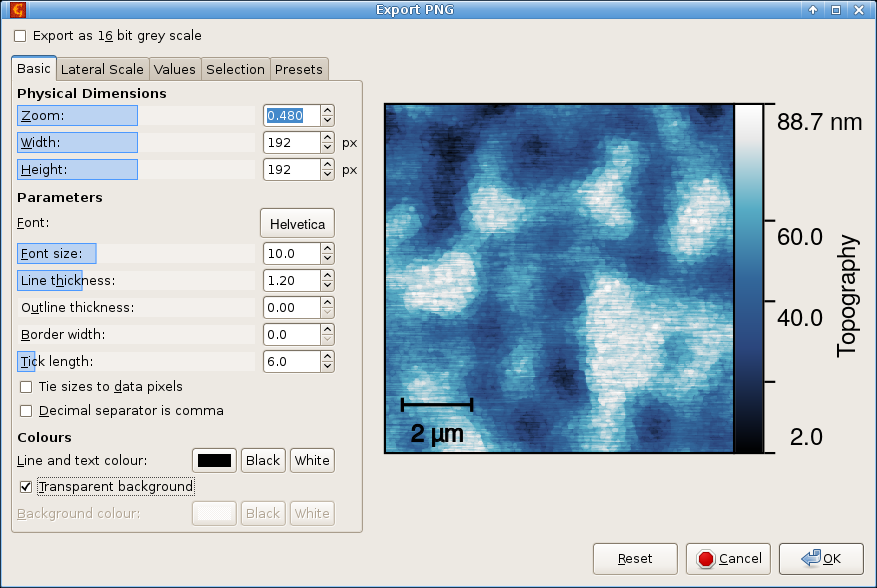
The image export options are divided into several groups, as seen in the above screenshot.
Basic options specify various overall sizes and scales. The Physical Dimensions part differs for raster and vector images. For raster images the physical dimensions are specified as follows:
- Zoom
Scaling of data pixels to image pixels. The default zoom of 1 means data pixels correspond exactly to image pixels. Upscaling is possible with zoom larger than 1, and downscaling with zoom smaller than 1. For data with non-square pixels displayed with physical aspect ratio, the zoom is applied to the shorter side of the pixel, whichever it is.
- Width
Width of the rectangle corresponding to data in the exported image (not width of the entire image), in pixels.
- Height
Height of the rectangle corresponding to data in the exported image (not height of the entire image), in pixels.
Vector images do not have finite pixel resolution, therefore, the physical dimensions can be instead given as follows:
- Pixel size
Size of one data pixel in millimetres.
- Pixels per inch
Number of data pixels per one inch.
- Width
Width of the rectangle corresponding to data in the exported image (not width of the entire image), in millimetres.
- Height
Height of the rectangle corresponding to data in the exported image (not height of the entire image), in millimetres.
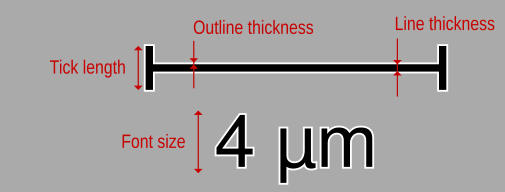
The remaining size and scale parameters, denoted Parameters, are common to both image types. However, for raster images the values are in pixels while for vector images they are in typographical points. More precisely, this is true if they are given as absolute, i.e. the option Tie sizes to data pixels is not selected. If this option is selected all sizes are relative to data pixels, i.e. they scale together with the image data when the physical dimensions change. The parameters, illustrated in the figure above, include:
- Font
The font used to draw all labels.
- Font size
Font size, in pixels or typographical points as described above.
- Line thickness
Thickness of lines: borders, ticks, inset scale bar and selections.
- Outline thickness
Thickness of outlines that can be drawn around the inset scale bar and selections.
- Border width
Width of empty border around the entire image.
- Tick length
Length of ruler and false colour map ticks. This setting also controls the inset scale bar ticks and crosses drawn for the point-like selection.
Option Decimal separator is comma permits controlling the format of numbers. By default, decimal dots are used even if your locale setup specifies commas. Enabling this options replaces the dots with commas, again independently on the actual locale.
Finally, Colour options permit controlling common colours. Line and text colour controls the colour of all lines and labels drawn outside the image area, that is over the background. The background can be transparent (enabled with Transparent background check-box) if the target image format supports it – this currently includes PNG, WebP and all vector formats. Otherwise the background is solid colour can be changed using the Background colour control.
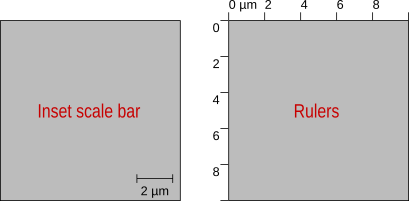
Settings in the Lateral Scale page control how the lateral dimensions are visualised. There are two basic choices displayed in the figure below, rulers and an inset scale bar. The lateral scale can be also disabled entirely. The inset scale bar has the following settings:
- Length
The bar length can be set manually to an arbitrary value which does not result in a too short or too long bar. Press Enter to update the preview when you modify the length. Button selects a suitable length automaticaly (this is also done when the manually entered length is not found reasonable).
- Placement
The bar can be placed along the upper or lower edge and aligned to either side or centered.
- Horizontal gap
Horizontal gap between the bar and the closer vertical edge of the data area (meaningful only if the bar is not centered).
- Vertical gap
Horizontal gap between the bar and the closer horizontal edge of the data area.
- Colour
Colour with which the bar is drawn. Buttons and allow choosing quickly the basic colours.
- Outline colour
Colour of the outlines. Note if the outline width is zero (the default), no outlines are drawn, hence changing the colour has no effect.
- Opacity
Opacity with which the inset scale bar is drawn. This setting permits drawing the bar as semi-transparent.
- Draw ticks
If enabled, the bar has vertical ticks at its ends. When disabled, the bar is just a line.
- Draw label
If enabled, the bar length is displayed under or above the bar.
- Draw text above scalebar
If enabled, the bar length is displayed above scalebar, otherwise below.
Settings in the Value page control the rendering of values and false colour mapping. Two basic settings control the rendering of field data:
- Interpolation
The interpolation type can be noticeable particularly for large zooms. In the case of vector image formats, the final rendering is done when then the image is viewed or printed. Hence the available interpolations are limited to two types. Round, in which each data pixel is drawn as a sharp rectangle, and Linear, in which values in the rendered image are linearly interpolated between original data pixels. In the case of raster images, you can choose from the full set of interpolations supported by Gwyddion because the interpolation is done during the export.
- Draw mask
If enabled, the mask is drawn on top the data using the same colour as in the data window.
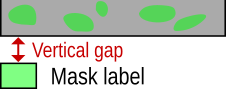
When a mask is present and shown then optionally a mask legend can be added below the image as illustrated in the following figure if Draw mask legend is enabled. The label can be specified arbitrarily using the Label entry and the spacing is controlled by Vertical gap.
The value scale can be rendered as a false colour ruler or disabled. The ruler is drawn somewhat differently depending on the false colour mapping type, as illustrated in the following figure.
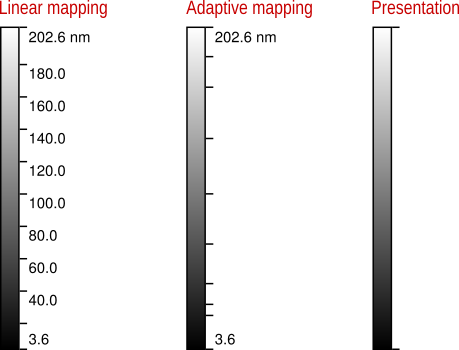
Rendering of the false colour map scale depending on the mapping type. For the standard linear mapping, whether full or fixed range, ticks with values are drawn. For an adaptive mapping the colour gradient is drawn the same, but tick positions correspond to the adaptive mapping and interior ticks are drawn without labels (to avoid overlapping labels). If a presentation is shown, the values are considered arbitrarily scaled thus no values and interior ticks are displayed.
It is possible to set the number of decimal places for the tick marks by enabling Fixed precision and specifying the number. Otherwise a suitable precision is determined automatically.
The automatic choice of units for the false colour map scale can be adjusted using Fixed kilo threshold. It gives the threshold for switching to the next power of 10³, e.g. from nm to µm or from pA to nA. For instance, setting it to 400 means that if the maximum absolute height is 399 nm it will be displayed as 399 nm, whereas if it is 401 nm it will be displayed as 0.401 µm. The threshold applies to all powers of 10³ so for the same setting the units would switch from mV to V at 400 mV or from pA to nA at 400 pA.
The image title can be optionally added to the top of the image or along the false colour ruler. Using the check-box Put units to title, the placement of value units can be chosen between the title and false colour ruler. Note if the no title is drawn then placing units to the title disables them entirely.
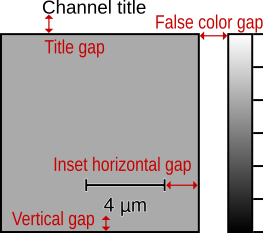
Settings Horizontal gap for the false colour ruler and Gap for the title control the gaps between them and the corresponding image edges as shown in the following figure. If the title is drawn along the false colour ruler the gap can be negative, moving the title a bit inside the ruler. For titles along the top edge, negative gap values are ignored.
Any kind of selection stored with the data can be also shown in the image. If the check-box Draw selection is enabled you can choose the selection to draw from the list below. The colours are specified in the same manner as for the inset scale bar:
- Colour
Colour with which the selection is drawn. Buttons and allow choosing quickly the basic colours.
- Outline colour
Colour of the outlines. Note if the outline width is zero (the default), no outlines are drawn, hence changing the colour has no effect.
- Opacity
Opacity with which the selection is drawn. This setting permits drawing the selection as semi-transparent.
Beside the colours, some selection types have further options, for instance whether individual shapes are numbered. If you are using a tool that has some shapes selected on the data, the kind of the selection to draw and the specific options are preset to match the current tool. This is usually the most convenient way to get the selection drawn as you intend. However, any existing selection can be drawn and the options adjusted manually if you wish.
Different sets of image rendering options are useful on different occasions. A set of options can be saved as a preset and recalled later. The list in the Presets page shows all saved presets that can be managed using the buttons below:
Loads the currently selected preset, i.e. sets the image rendering options according to the preset. The inset scale bar length can be set to the automatic value if the stored length is not found reasonable. Also the selection type and its options are kept intact, only the colours are set according to the preset.
Stores the current options under the name given as Preset name. The name also serves as a file name so it is advisable to avoid odd characters in the preset name. If a preset of the same name already exists, it is overwritten.
Renames the currently selected preset to the name given as Preset name. The preset does not have to be loaded for renaming. It is not possible to overwrite an existing preset by renaming.
Deletes the currently selected preset.