User Influence Study Remarks – Rough surface
This page summarises some thoughts on what works well and what might not work well in the analysis of similar scans. It is not a definitive guide, nor a standard procedure – please ask your nearest metrology institute or ISO committee if you need that.
The task (recapitulation)
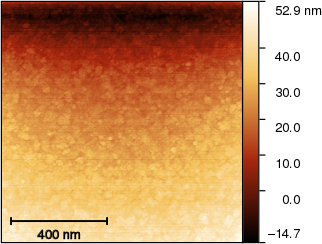
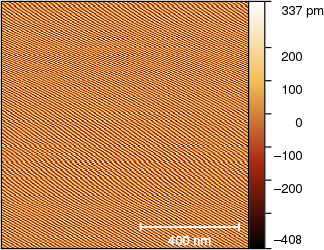
Sample data 2: Rough surface
Description: Rough surface measurement on a commercial sample showing line misalignment and also some small scanner bow. The reported value should be mean square roughness (Sq) as obtained using the Statistical Quantities tool in Gwyddion.
In this case it is not difficult to obtain a value. However, every correction influences the roughness rms one way or another. The variance of obtained values will be therefore quite interesting.
Reported value: Roughness rms Sq (single value, in nanometres).
Result
The submitted values are displayed in the following random beehive plot (i.e. vertical positions of the dots help visualising the point density, they do not represent any quantity). Note that a few order-of-magnitude wrong outliers were excluded and attributed to misunderstanding, wrong units, etc.
The submitted values for this image differ from the other two. Here we can see an evident large group of people who obtained more or less correct values. This, sadly, does not hold for the other two images.
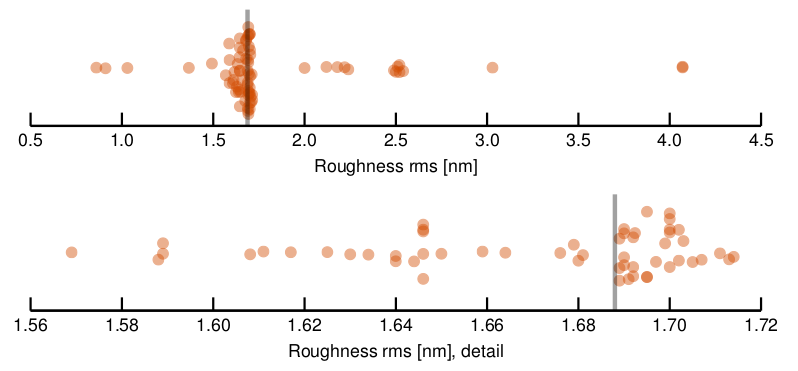
In this case we do not know the correct value precisely.
Our best estimate of the correct value is 1.69 nm, with caveats. It is denoted by the grey bar in the graph.
Roughness calculation
The task specified using the Statistical quantities tool. In hindsight, this might be overspecification. In any case, since individual rows exhibit considerable bow we have to apply a relatively strong line correction. Function

can perform Polynomial levelling of each row and degree 2 is necessary to obtain globally flat mean surface:
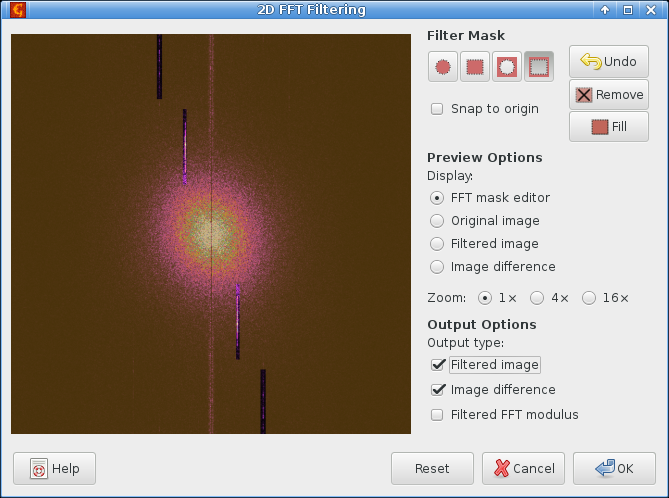
The image still contains high-frequency hum that can be seen in the Fourier transform (or in a detailed image). And Fourier-domain filtering is also the method that can remove it.
We can use the simpler one-dimensional FFT filter but the hum overlaps with spatial frequencies of the roughness in this case. So we use the more complex
and filter out only the unwanted frequencies:
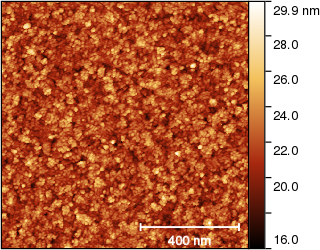
This removes the hum from the image, and we can also simultaneously extract it to a new image:

The result image is free of artifacts. Therefore we can use

and obtain the Sq value 1.64 nm.
But wait. This is a different value than advertised. So here comes the ‘with caveats’ part.
The problem is that we applied row levelling. It turns out that this removes a lot of degrees of freedom, more than one might expect without thinking about the problem too much. In consequence, the Sq value is biased. Specifically, the calculated roughness is systematically too low.
We are currently working on an article that will explain all the details and propose a method to remove the bias. At this moment, according to Yeti's calculations the bias-corrected estimate is 1.69 nm.
