User Influence Study Remarks – Artificial step
This page summarises some thoughts on what works well and what might not work well in the analysis of similar scans. It is not a definitive guide, nor a standard procedure – please ask your nearest metrology institute or ISO committee if you need that.
The task (recapitulation)
Sample data 3: Artificial step
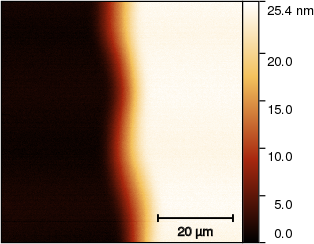
Description: Artificially created smooth step with known height and various error sources added, like polynomial bow, PID loop effects, noise. The reported value should be the step height, determined by any Gwyddion function you consider suitable.
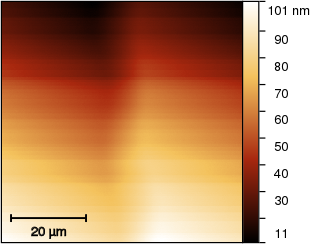
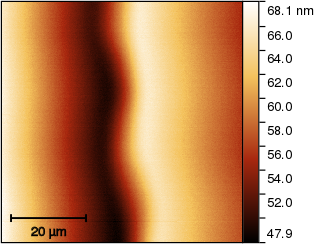
The image reproduces typical measurements of fuzzy and wobbly steps created by simple substrate masking during thin film deposition. Do not look for a nice sharp step that can be created using litography. But a step is certainly there and the difficulty of measuring its height is why this type of data was selected.
Reported value: Step height (single value, in nanometres).
Result
The submitted values are displayed in the following random beehive plot (i.e. vertical positions of the dots help visualising the point density, they do not represent any quantity). Note that a few order-of-magnitude wrong outliers were excluded and attributed to misunderstanding, wrong units, etc.
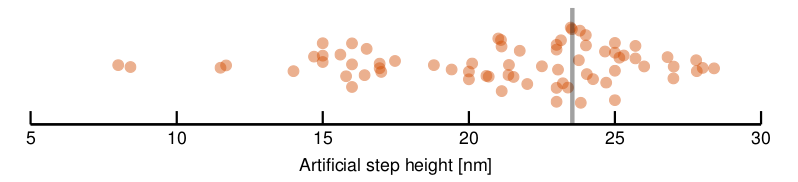
The correct step height was 23.54 nm. It is denoted by the grey bar in the graph.
Based on our experience, it should be measurable within 2% relative error from a similar image.
In this case we know the correct height precisely because the image contained simulated data. It is notable that even though we know what artifacts were added, the analysis below does not consist of careful correction of these artifacts in reverse order. First, we do not know how to remove them all precisely and reliably. And second, … You will see.
Agnostic approach
The step edges seem conveniently oriented in the vertical direction (at least well enough). However, there are many artifacts we have to deal with, such as:
- tilt, the mean plane is not horizontal
- bow, the mean plane is not actually a plane but a curved surface
- scan line misalignment
- noise
Or do we?
Each scan line contains the step profile. From the image description it is reasonable to assume the lower an upper surfaces of the step should be close to flat planes. Individual profiles are just not very nice, they are mutually shifted, noisy and somewhat distorted. Is there anything that can take all image rows and create a nicer, representative profile from them? There is:

So, without any correction, we switch to the tool, select the mean value by column, and obtain the following average profile. If there are local defects on the surface the median value often works better, but the idea is the same.
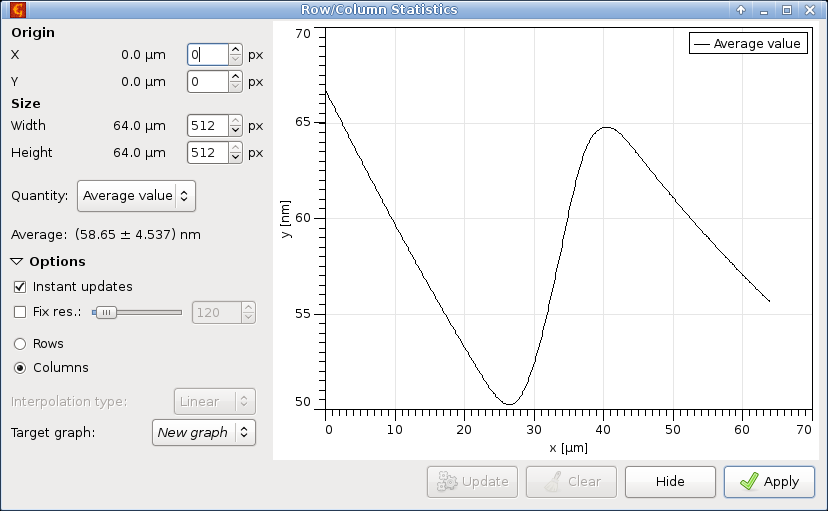
It may seem the profile is terribly tilted but we note that the vertical axis range is about 3000× smaller than the horizontal range. So the tilt is actually quite small and all is well. But still, a tilt is there and some bow as well.
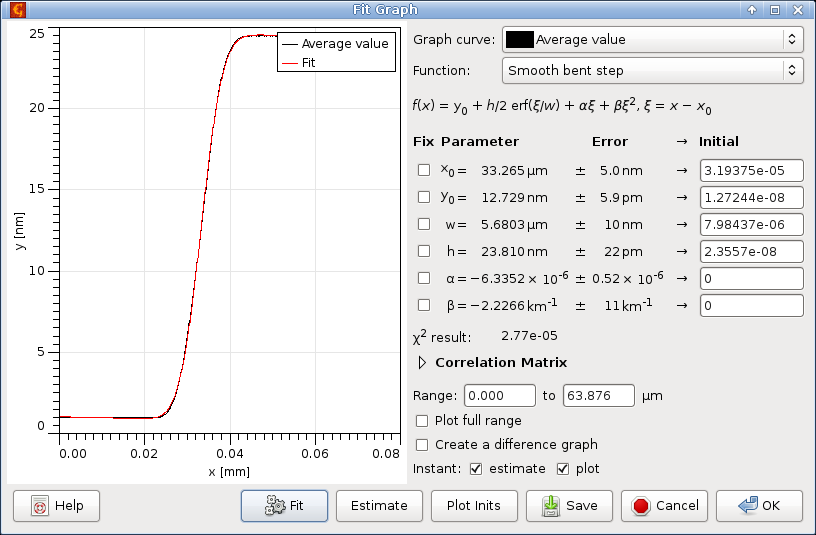
This cannot stop us. In

we choose Smooth bent step, click on Estimate, click on Fit, and obtain the following results:
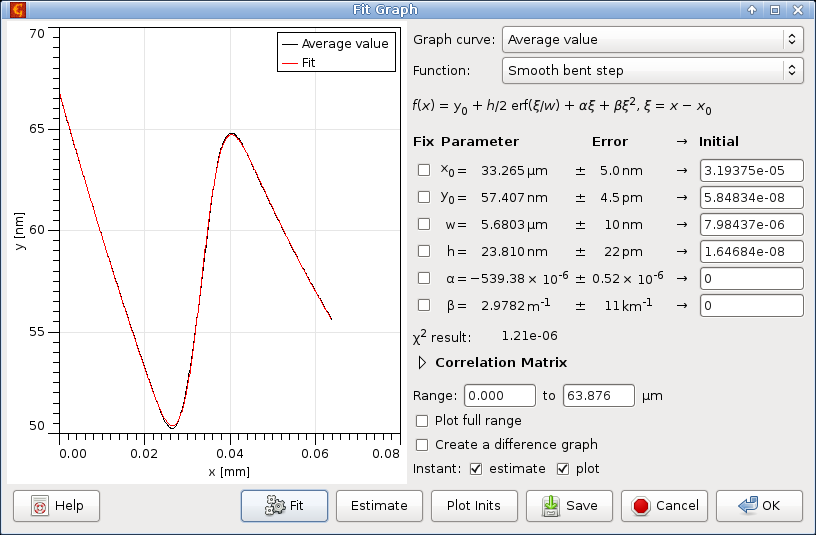
The fit is quite good and according to the fitting function sketch, parameter h is what we are looking for.
Is the value h = 23.81 nm any good?
Well, it is within 1.5 % of the correct value (and we beat most people participating in the survey). So probably yes.
A remarkable property of this procedure is that it requires practically no user input. The only substantial decision is which function to fit to the average profile. With that decided, everyone should be able to obtain exactly the same value from survey image.
Aesthetic approach
The procedure in the preceding section fails in one regard: We have still no idea what the step looks like! Apart from the ugly input image, of course.
This is not insubstantial. For visualisation and figuring out what we deal with and how to deal with it, recovery of the relevant features is invaluable. So let us try correcting the artifacts.
First the correction of scan row misalignment. It does not matter much what we choose in

because any of Median, Median of differences, Matching and Polynomial of degree 0 (i.e. mean value) will give similar results here. They would differ more if there were local defects on the surface. Note that Median of differences aligns the rows but preserves the overall tilt, so plane levelling has to be applied afterwards to get a comparable result:
The position of the step in the image centre can cause trouble in row alignment. Since the values in the left and right part of each are quite different, mean or median values from rows can be unstable.
This did not happen here but when it does we have a few options, including:
- Mask Editor tool (or some other mask creation method) to mark only the supposed upper or lower plane and apply masking in Align Rows
- Median of differences method which works with differences between rows and thus is unaffected
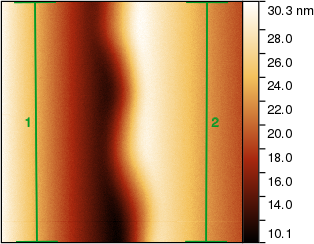
- Path Level tool to align only along selected lines
The result of the last approach is again similar:
The next step is removal of tilt and bow. We encounter the same problem: Plane or polynomial levelling cannot be directly applied to image that has a large step just in the middle. One option could be to use

but it does not work that well for noisy images and this one is quite noisy. The noise could be reduced using a denoising filter, such as the Gaussian filter, but that starts to sound complicated and would still left the bow there. Instead, we use

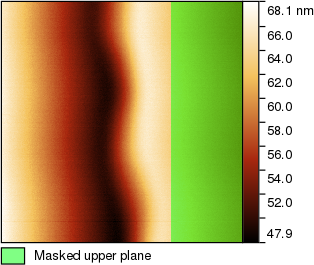
and just draw a large rectangle over one of the planes (preferably the larger one if their sizes differ). It does not have to be precise at all. It is much more important to exclude the edge area than to include the supposedly planar part completely. So we can draw a rectangle like this:
Again, there are alternatives. For instance, we could use the Three-point levelling tool to remove the tilt approximately, then Otsu's threshold to mark the upper plane area more precisely and then shrink the mask using the mask editor to ensure it does not include the edge area. If the shape of the approximate area to mask was more complicated this might be a better approach.
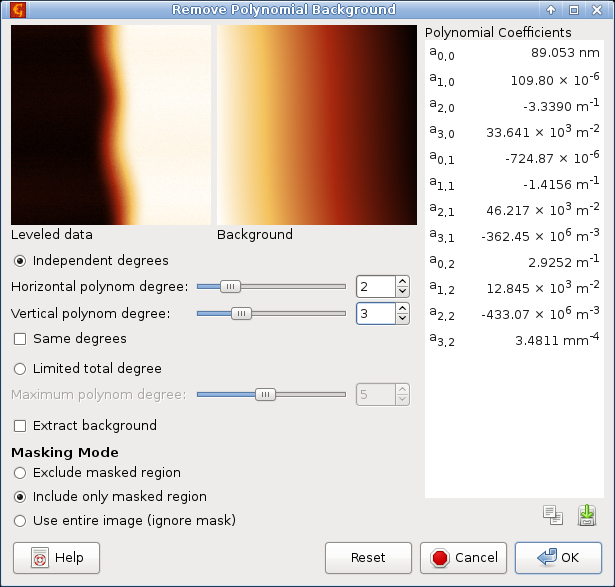
In any case, with the upper plane masked, we use

and subtract the tilt and bow from the image. Two things are important:
- select Include only masked region, otherwise marking it would be pointless
- use as low polynomial degrees as possible (while still correcting the background) because we extrapolate the background from a relatively small region to the entire image
The final result is a nice step. It is still smooth and wobbly but that is its nature so we will not try to ‘correct’ it.
We can now try again the step measurement described in the beginning. After taking column mean values and fitting them with the smooth bent step function we obtain:
The obtained height is h = 23.81 nm.
Again.
So, after all the work, we achieved absolutely nothing in terms of the step height value. The value is not a magical constant though. In fact, the precision with which we obtained the same value is more of a coincidence. Various variations of the procedure described above lead to somewhat different results, generally differing up to a few tenths of a nanometre.
However, as essentially all we did was the correction of row mismatch, tilt and bow, i.e. artifacts the procedure is designed to be resistant to, there is not really a reason for any substantial difference between the results with and without corrections.
